Hover over a leaf to view details.
Blooming
Exploring Poverty in the Pacific Region
How does the risk of living in poverty vary by gender, age and whether you live in an urban or rural area in a Pacific country?
A Data Visualization Project by Kristin Baumann
Legend
This visualization displays the percentage of population below the national poverty line by 4 attributes:
Location Each plant represents a country.
Age Two leaves with their two according flower branches represent an age group, ordered in ascending order from bottom to top.
Urbanisation Each side of a plant represent the type of urbanisation (left side for rural, right side for urban areas).
Gender Each flower branch consists of two flower clusters where the left side represents the male and the right side the female population. See details below.
Leaves
Leaves represent the percentage of population below the national poverty line regardless of gender for one location, one age group and either urban or rural areas.
Flower Clusters & Blossoms
Flower clusters and blossoms show the percentage of population below the national poverty line regarding the gender for one location, one age group and either urban or rural areas.
About
Topic
Poverty and gender inequality are deeply interconnected issues that affect millions worldwide. Addressing poverty requires understanding and tackling the various barriers that different groups face.
In the Pacific region, these challenges are similar to those found globally, with some countries or regions experiencing elevated levels of poverty and various degrees of gender inequality. Efforts to address these issues are critical to achieving Sustainable Development Goal Number 1 "No Poverty," which aims to shed light on the root causes and manifestations of poverty globally.
However, the data for the Pacific region shows that poverty levels cannot be generalized to one gender, as they vary significantly based on factors such as urbanization, age, and location. Understanding these nuances is essential for creating effective and targeted interventions. By implementing inclusive development strategies that consider the unique needs of all individuals, we can create more equitable and prosperous societies in the Pacific and beyond.
Visualization
This visualization highlights the proportion of the population living below the national poverty line while looking at the attributes of gender, location, age, and urbanization.
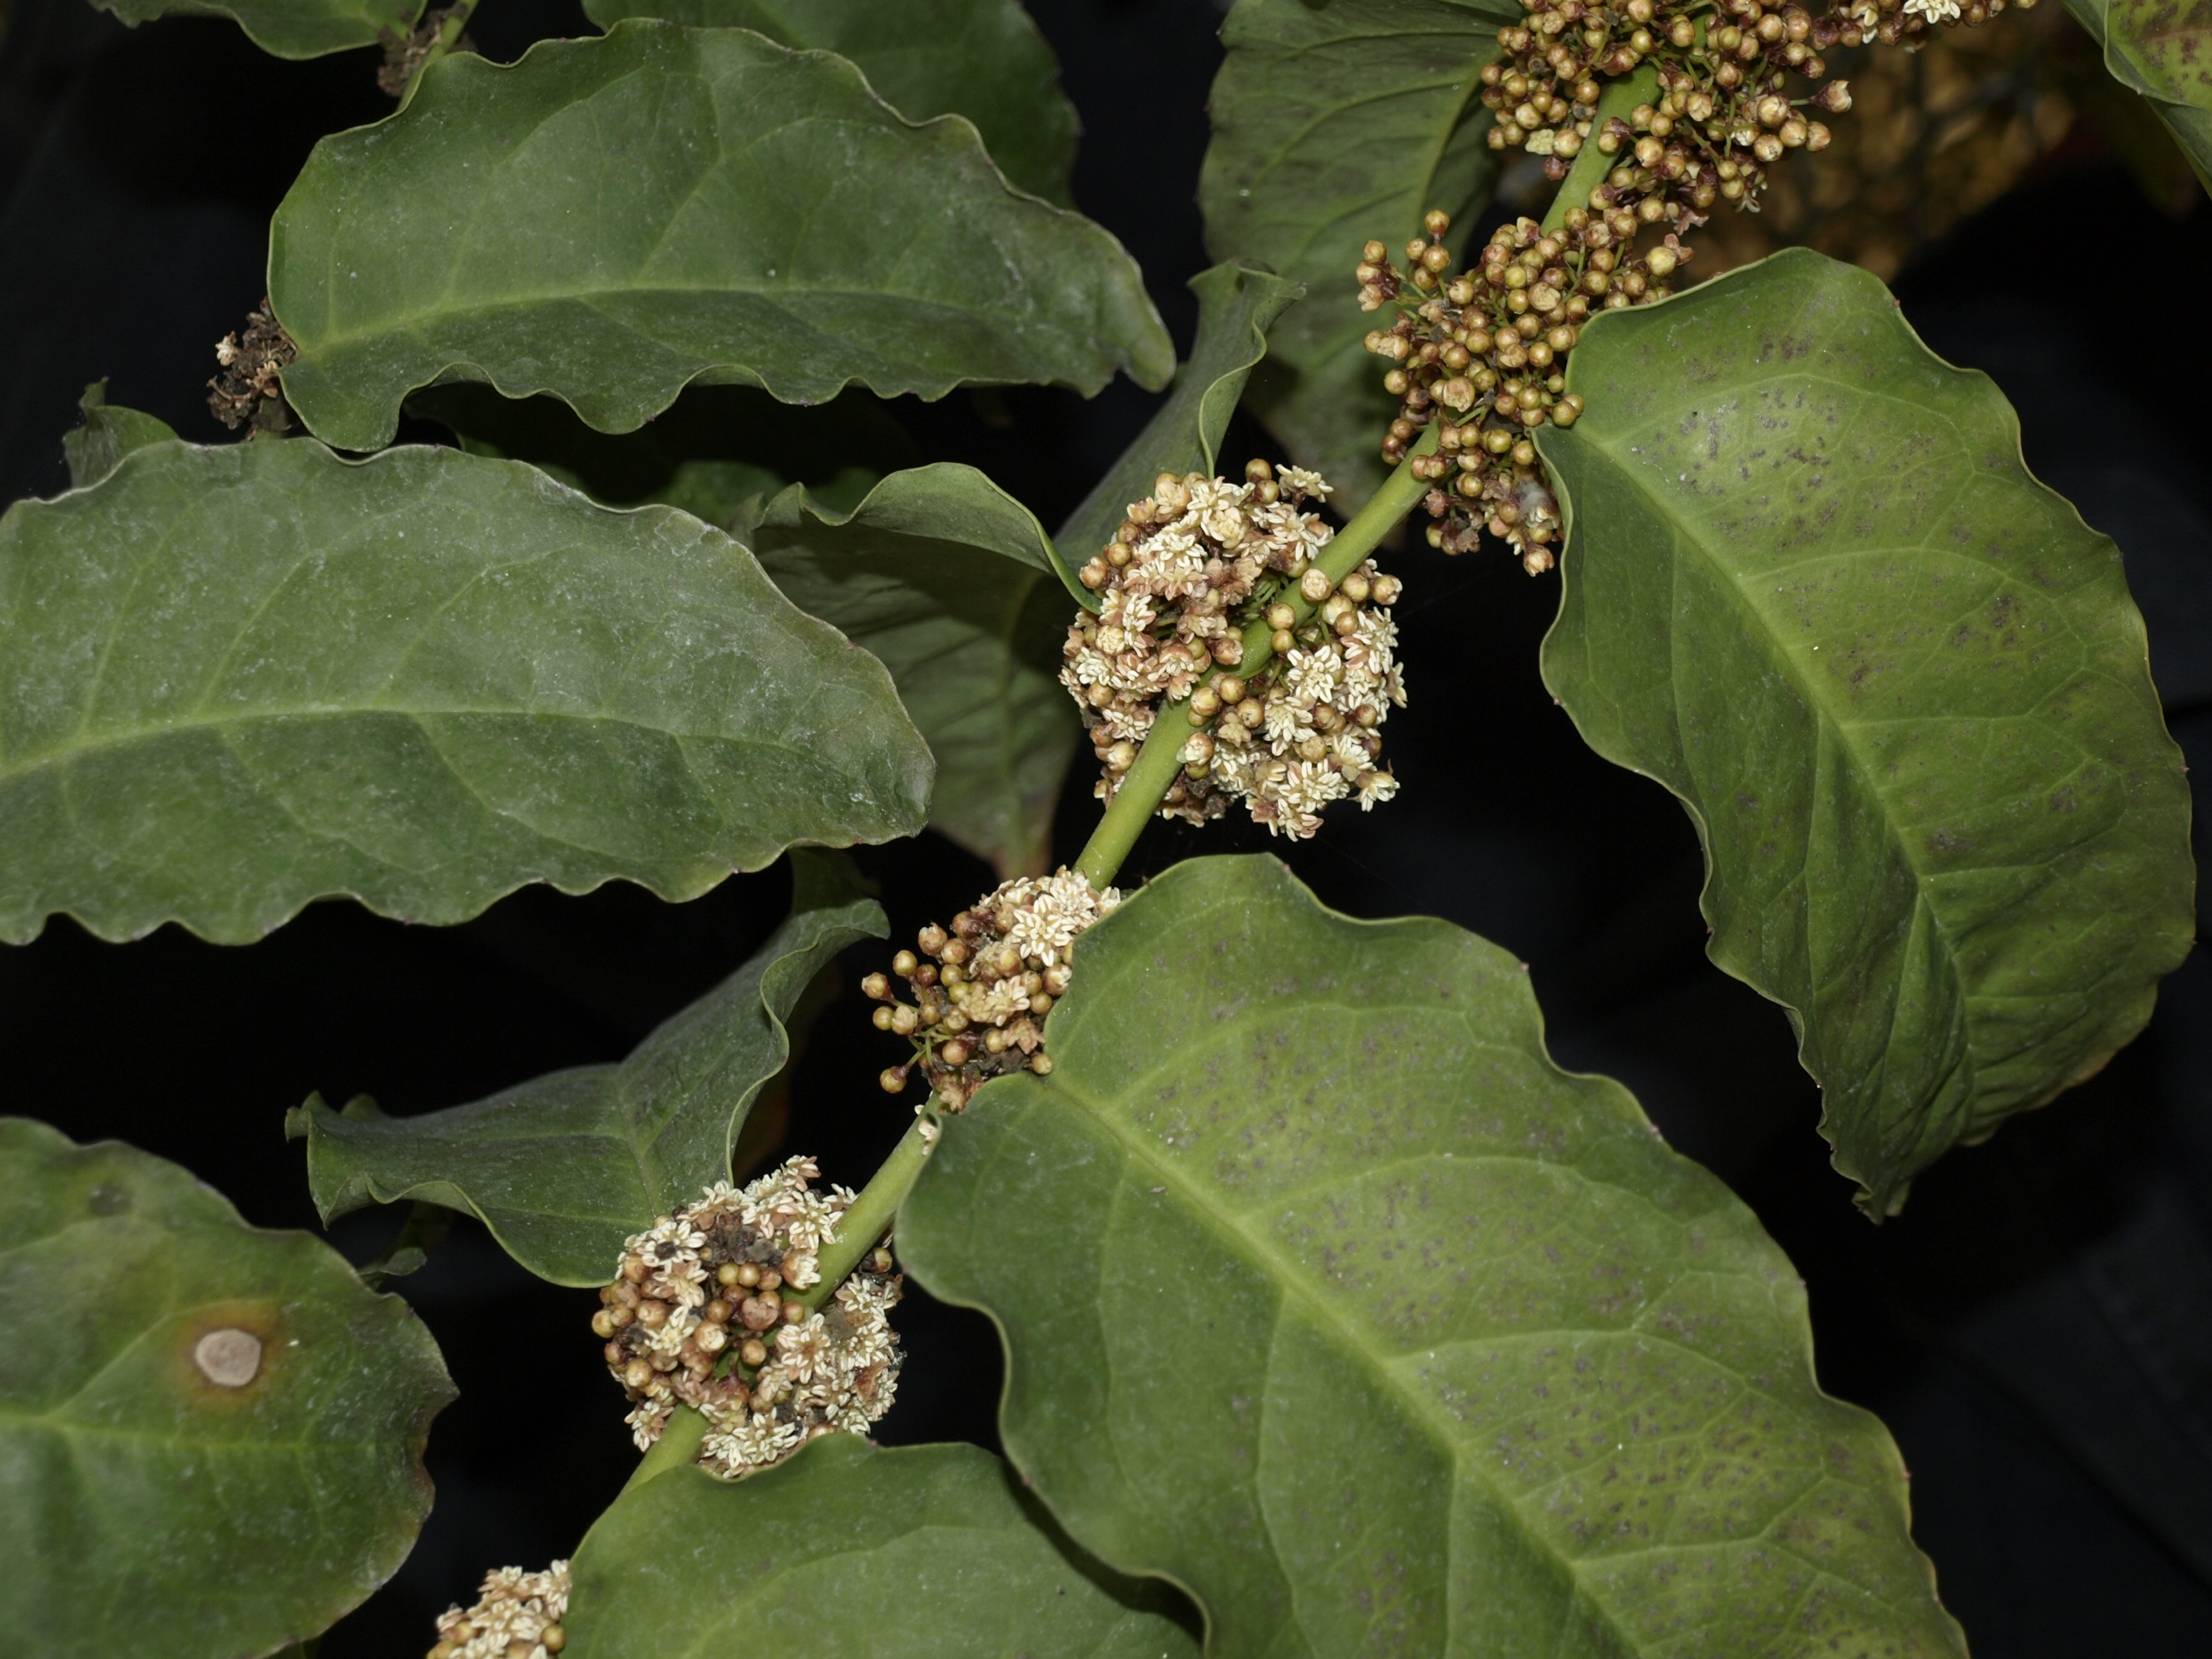
The project, titled "Blooming", uses the analogy of a plant with blooming flowers to symbolize growth and a journey out of poverty for all age groups, urbanization levels, and regions. A big flower with lots of blossoms shows that a group of people of a specific age in an either urban or rural location only rarely faces poverty. This community blooms. By looking closer at the white-yellowish blossoms one can then explore the gender-based differences in facing poverty in detail via tooltips.
The stylized plant resembles the plant Amborella trichopoda which is only endemic to New Caledonia's forests and therefore cannot be found anywhere else on the planet. This metaphor also points out that the status quo of poverty related to gender, the reasons for such a status quo, and a way to reduce poverty is unique to the Pacific region while the data collection for indicators like the Sustainable Development Goals is done globally.
Data & Methods
This project uses the data for the "Sustainable Development Goal Nr. 1 No Poverty" with the specific indicator 1.2.1 "Population below national poverty line" retrieved from the Pacific data hub on May 28, 2024. The data only includes detailed percentages for the three shown countries in the Pacific region for the year 2019. The data points are mapped to the custom data encoding of the plant as shown in the legend above. The threshold to mark a notable gender-based difference in the percentage of the population below the poverty line is set to a 1.5% difference. See tooltips for details.
The project was conceptualized, designed, and coded by Kristin Baumann. It uses Svelte and D3 as underlying technology for the visualization and was developed as part of the Pacific Data Visualization Challenge 2024.